Simple Data Cleaning
-
Processed a 5,000-record CSV file from a Python library to demonstrate essential data-cleaning techniques.
-
Gained foundational Excel skills, including navigating menus and applying formulas, through a hands-on lab exercise focused on practical data-cleaning challenges.
-
Addressed challenges in handling messy data, such as removing extra spaces and standardizing text formats, to ensure data consistency and accuracy.
AFTER

BEFORE

Basic Excel Worksheet
-
Created a basic spreadsheet demonstrating Excel fundamentals, including Data Validation to restrict input to predefined lists.
-
Applied IFERROR for error handling, providing clear feedback to users when formulas result in errors and improving user experience and understanding.
-
Developed foundational Excel skills by working with menus, applying error-checking techniques, and organizing data effectively.
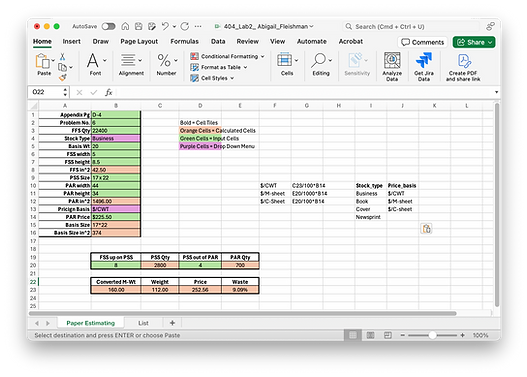
Basic Budget Template

-
Designed a spreadsheet demonstrating Contextual Menus using the INDIRECT function, where menus dynamically depend on another column's selection.
-
Utilized Conditional Formatting to distinguish debits (red cells) visually and credits (green cells), enhancing data readability and interpretation.
-
Dropdown menus in the purple section were included for user-friendly input, ensuring consistency and reducing errors.
-
Created a simple budget template showcasing dynamic menus, logical formatting, and robust error handling.
Advanced Lookup Tables
-
Used VLOOKUP, HLOOKUP, and MATCH functions to retrieve data based on user inputs dynamically, enabling precise cost estimations.
-
Applied Conditional Formatting to highlight important values, improving data visualization and interpretation.
-
I used the NOT(ISNUMBER(...)) function to identify and handle invalid inputs, ensuring the spreadsheet's accuracy and user-friendliness.
-
Gained a deeper understanding of advanced lookup functions, including their structure and navigation, laying the groundwork for more complex applications in the midterm project.

Midterm Study Guide
-
Explored SUMIF and VLOOKUP in ink cost estimating, addressing challenges with variable rows and columns through structured naming of table arrays, lookup arrays, and menus.
-
Applied Nested MATCH statements to handle multi-dimensional data in Function Point Analysis, accommodating both row and column variables.
-
Incorporated advanced AND/OR/NOT logic in Conditional Formatting to highlight key insights dynamically.
FINAL WORKSHEET

TABLES

Tableau World Indicators
-
Developed a project utilizing a provided Tableau dataset of various global indicators to visualize key statistics, enhancing my understanding of data representation.
-
Learned to create line plots to effectively illustrate trends over time for different world indicators, allowing for the analysis of changes in metrics such as GDP, population growth, and literacy rates.
-
Designed bar graphs to compare multiple countries or regions across specific indicators, facilitating easy identification of disparities and patterns in data.
-
Created population maps to visualize demographic distributions geographically, helping to contextualize data within a global framework and enhancing spatial awareness of population trends.

Video Game Dashboard
-
Utilized a Tableau template to recreate a comprehensive Video Game Dashboard, enhancing my dashboard design and data visualization skills.
-
Explored various visualization techniques to effectively display data trends and comparisons, facilitating a better understanding of the video game market landscape.
-
Developed proficiency in Tableau’s dashboard functionalities, including layout design, interactive elements, and filtering options, enabling users to engage with the data dynamically.

Cal Poly Student Information
-
I successfully created my first complete dashboard independently, focusing on visualizing data related to Cal Poly students, which provided a practical application of my Tableau skills.
-
Integrated multiple data sources to provide a comprehensive view of student information, facilitating analysis of trends over time and comparisons across various categories.
-
Utilized Tableau's features to create engaging visualizations, including charts and graphs, that simplify complex data and make it accessible to a broader audience.

Tableau Prep Builder Introduction
-
Gained foundational knowledge of Tableau Prep Builder as an effective tool for data cleaning, highlighting its capabilities beyond traditional Excel methods.
-
Enhanced understanding of the benefits of using Tableau Prep Builder for preparing data, including improved workflow and reduced complexity.

Prep Builder Student Information

-
Learned to create unions to combine multiple datasets, allowing for comprehensive data integration and analysis.
-
Gained experience in joining tables to establish relationships between different data sources, preparing them for effectual output.
-
Enhanced skills in data preparation by understanding the nuances of unions and joins, ensuring accurate and meaningful data for analysis in Tableau.
San Mateo Air BnB Listings Project
-
Engaged in a comprehensive data preparation process using Tableau Prep Builder, where I united and cleaned multiple datasets related to Airbnb listings in Munich and San Mateo.
-
Each cleaning process step was clearly labeled and articulated, enhancing transparency and making it easier to understand and revise if needed.
-
Ensured that the datasets were accurately processed, allowing for reliable outputs that set the stage for practical analysis in Tableau.
PREP BUILDER

-
Utilized cluster mapping to identify pricing patterns and group similar listings based on key attributes, facilitating targeted market analysis.
-
Employed geo-mapping to visualize the distance of listings from Theresienwiese, providing spatial context to the pricing data and highlighting geographical trends in Airbnb rentals.
-
Compiled a Tableau story to narrate the findings of the analysis, guiding viewers through the visualizations and emphasizing key insights and conclusions.
-
Additionally, I created intuitive graphs for the San Mateo dataset, focusing on simplifying designs to enhance readability and ensure that complex data is accessible to diverse audiences.
TABLEAU


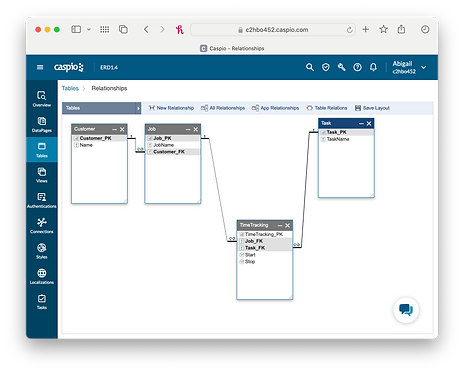
Caspio and Entity Relationship Diagrams
-
Created multiple Entity Relationship Diagrams (ERD) to visualize the tables and relationships within the database structure.
-
Sketched the diagrams on a tablet to conceptualize the design and organization of the data model.
-
Used Caspio to structure each ERD, implementing the diagrams into a functional database format.
-
Enhanced understanding of database relationships and data flow through the diagramming process.


SKETCH
CASPIO
SKETCH
CASPIO